 Figo3434
 sheeesh
 wAkKo
wAkKo _unicorn
I have created yet another tool for AoE2 rec analysis. This one is called UniBuild and it's meant to be used for comparing the execution of a build order with a given template. The main benefit is the ability to see the small differences between build order executions.
How to use
How to use
- Download an archive from the Google Drive folder.
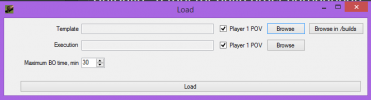
- Unpack the archive, run WF.exe. The loading form appears:
- Select the template build order (a .ura file, see this to learn how to get .ura files). There is also a special /builds folder you can put your templates in for the convenient access with "Browse in /builds" button.
- Select the execution .ura file.
- Configure the active player index for the template and execution recs (player 1 POV checkboxes). If, for example, an executor wasn't the player 1 (like if it was a game against a human opponent and the player wasn't hosting the lobby), uncheck the box. If both recs are played against the computer you most likely don't need to change anything. It's possible to compare the build orders in the same game (in that case, template and execution refer to the same file but one of the checkboxes is set to uncheck).
- Set the maximum build order time, if needed. The actual length of the part of the game being analyzed is the minimum of the template game length, execution game length and maximum BO time.
- Click the "Load" button. The loading form disappears. Wait for the application to load the data. About loading time: on my computer, it took ~10 seconds (both .ura files are ~5MB large).
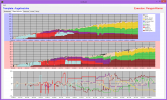
- The main form contains tabs representing different aspects of build order comparison. Blue charts correspond to the template, red charts correspond to the execution, white ones - to their difference. The project shares a lot of code with UniPlot so you can use UniPlot tutorial for learning.
- "Development" tab shows the development and production timelines (same as in UniPlot).
- "Villager distribution" tab contains stacked area charts for villager numbers of different categories. The difference chart below represents the difference in villager count. Left mouse click on charts activates a tooltip showing the exact numbers.
- "Resource" tab shows the resources stockpiled.
- Two upper charts in "Income" tab are the same as in UniPlot. The lower chart shows the difference in GDP (which, for build orders, roughly corresponds to the amount of resources gathered).
- The "Decay" tab represents the amount of food lost to rot on sheep and boars. Charts have the same meaning as in the "Income" tab. Light blue area - sheep decay, red area - boars decay.

 Umdeuter


 Hera
Hera  _Barles_
  Villese
  ACCM |AOEbuilds.com
 HGB_AOE
  [aM]_MbL40C_
  CDUB.dogao
  mYi.Sitaux
  __BadBoy__
  Lauth3
  Muhammed__