 The_Philos
 IYIyTh
 Adico
AdicoHello Everyone,
I decided to do some little record-keeping related to the event. Now, before I go any further I think I should make it clear that:
1. I am not a good AoE2 player, thus I won't be making a lot of judgments as to what civs are actually powerful or weak. I simply lack the critical information to do that atm.
2. I am not a formal statistician. So the stats I am laying out here might not be in the best format, in fact. I know that they aren't since I did the record-keeping in a game agnostic fashion. That is to say, it does not take into account that good players are always likely to win, or which civs went up against which in what particular map, etc.
With that said, I think they are neat to look at and might even inspire some discussion and/or further exploration of the games themselves to find something that could be useful for those playing or watching in the main event the coming weekend. One last thing, this is only from the top 16 and top 8 from both qualifiers.
Let's start at the top. This table shows the most picked civs, when in the draft they were picked, and their winrate.
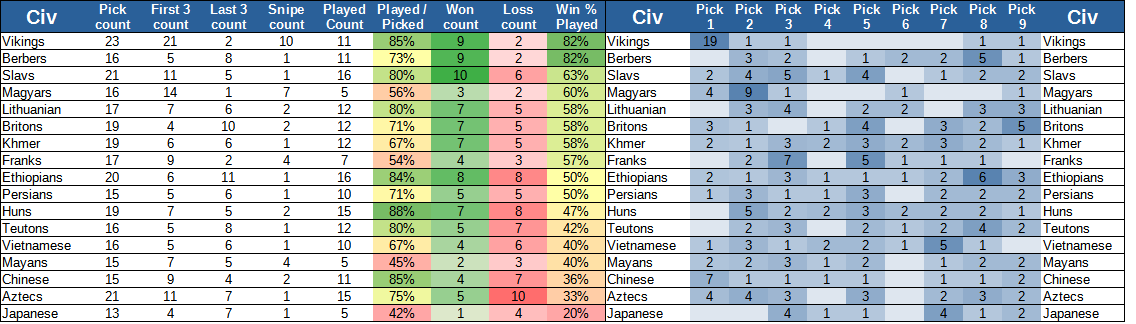
Given that most of the tables look like this I will give you a short legend on what each column means:

This chunky thing shows you a breakdown of how often a civ is picked in the draft. Again, not perfect since if mirror picks were allowed we would likely see mirror Vikings in first pick. But i think it does give an idea that civs like Indians and Cumans are not really picked at the start, but instead, a bit of a later grab. Also. Look at Ethiopians. Picked a lot in the end and yet:

They were basically chosen as the first civ to be played since Arabia was always the first map. In the screenshot, you can see the top 5 first picked civs and their usage on Arabia. This also leads to map stats. The top 5 maps played (outside of Arabia) were:
To this on Q2:
It got played less yes, but it also saw a pretty good usage in the games it showed up. Still, this is nothing compared to Lithuanians who in Q1 were looking like 2020 Ferrari:
But then for Q2 brought a 2019 Mercedes and started to look better:
A final stat I want to throw in here is the difference in winrate of some civs from Top16 games to top 8 games. PArticularly how Slavs went from being a somewhat secured pick, into more of a gamble:

Also, just for the sake of completeness, here is a massive table with a total of everything. Enjoy.

I don't have the sheet up in google drive yet, I might do that at some point. But in the meantime, if you want to see a particular breakdown let me know and I will post it.
I decided to do some little record-keeping related to the event. Now, before I go any further I think I should make it clear that:
1. I am not a good AoE2 player, thus I won't be making a lot of judgments as to what civs are actually powerful or weak. I simply lack the critical information to do that atm.
2. I am not a formal statistician. So the stats I am laying out here might not be in the best format, in fact. I know that they aren't since I did the record-keeping in a game agnostic fashion. That is to say, it does not take into account that good players are always likely to win, or which civs went up against which in what particular map, etc.
With that said, I think they are neat to look at and might even inspire some discussion and/or further exploration of the games themselves to find something that could be useful for those playing or watching in the main event the coming weekend. One last thing, this is only from the top 16 and top 8 from both qualifiers.
Let's start at the top. This table shows the most picked civs, when in the draft they were picked, and their winrate.
Given that most of the tables look like this I will give you a short legend on what each column means:
- Civ = Civilization name.
- Pick count = The number of times that civ was picked in the draft.
- First 3 count = The number of times that civ was picked within the first 3 picks.
- Last 3 count = The number of times that civ was picked within the last 3 picks. For the top 16 games these would be picks 5, 6, and 7. While for top 8 it is 7, 8, and 9.
- Snipe count = The number of times a civ was sniped in the draft.
- Played count = The number of times the civ was played.
- Played / Picked = The percentage that civ was played when available. This also takes into account if the civ was sniped. For example if a civ was picked 3 times, sniped 1 and played 2 times it would have 100% Played / Picked.
- Won count = The number of games that civ won.
- Loss count = The number of games that civ loss, I know it might seem repetitive, but it might help visualize the info.
- Win % Played = This can be though off as "Winrate" but its not a measure of how many wins per pick, but how many wins per Played. So if a civ was no played it does not lower their winrate.
- Pick 1-9 = the number of times a civ was picked in that draft position. The way I combined the 7 civ drafts and the 9 civ drafts were by moving the last 3 picks from the 7 civ drafts into the 7, 8, 9 spaces and moving the 4th pick into the 5th pick.
This chunky thing shows you a breakdown of how often a civ is picked in the draft. Again, not perfect since if mirror picks were allowed we would likely see mirror Vikings in first pick. But i think it does give an idea that civs like Indians and Cumans are not really picked at the start, but instead, a bit of a later grab. Also. Look at Ethiopians. Picked a lot in the end and yet:
They were basically chosen as the first civ to be played since Arabia was always the first map. In the screenshot, you can see the top 5 first picked civs and their usage on Arabia. This also leads to map stats. The top 5 maps played (outside of Arabia) were:
- Land Madness, and Slavs take the crown with 8 times picked for this map.
- Colosseum, with Lithuania getting the most playtime at 5.
- Cross, Was the land of Huns (8) and Persians (5)
- Haboob, aka *** * ******. Was a threeway split with Berbers, Britons, and Lithuanians at 3 each.
- Kawasan, had the Japanese on top with 4 but followed closely with Aztecs and Franks with 3.
Civ | Pick count | First 3 count | Last 3 count | Snipe count | Played Count | Played / Picked | Won count | Loss count | Win % Played |
Britons | 9 | 2 | 5 | 1 | 7 | 88% | 3 | 4 | 43% |
Civ | Pick count | First 3 count | Last 3 count | Snipe count | Played Count | Played / Picked | Won count | Loss count | Win % Played |
Britons | 10 | 2 | 5 | 1 | 5 | 56% | 4 | 1 | 80% |
It got played less yes, but it also saw a pretty good usage in the games it showed up. Still, this is nothing compared to Lithuanians who in Q1 were looking like 2020 Ferrari:
Civ | Pick count | First 3 count | Last 3 count | Snipe count | Played Count | Played / Picked | Won count | Loss count | Win % Played |
Lithuanian | 8 | 5 | 2 | 1 | 4 | 57% | 0 | 4 | 0% |
Civ | Pick count | First 3 count | Last 3 count | Snipe count | Played Count | Played / Picked | Won count | Loss count | Win % Played |
Lithuanian | 9 | 2 | 4 | 1 | 8 | 100% | 7 | 1 | 88% |
A final stat I want to throw in here is the difference in winrate of some civs from Top16 games to top 8 games. PArticularly how Slavs went from being a somewhat secured pick, into more of a gamble:
Also, just for the sake of completeness, here is a massive table with a total of everything. Enjoy.
I don't have the sheet up in google drive yet, I might do that at some point. But in the meantime, if you want to see a particular breakdown let me know and I will post it.


 Hera
Hera  _Barles_
  Villese
  ACCM |AOEbuilds.com
 HGB_AOE
  [aM]_MbL40C_
  CDUB.dogao
  mYi.Sitaux
  Lauth3
  Muhammed__